| https://www.medicaid.gov/themes/custom/medicaid/dist/img/usa-icons-bg/search--white.svg | Search | Looks good | — | 0 KB | 5817 | 11634 |
|---|
| https://www.medicaid.gov/themes/custom/medicaid/dist/img/usa-icons/close.svg | Close | Looks good | — | 0 KB | 5817 | 11474 |
|---|
| https://www.medicaid.gov/themes/custom/medicaid/images/logo/medicaid_logo_green.svg | Medicaid.gov-Keeping America Healthy 2 alt variants | Looks good | — | 3 KB | 5817 | 5817 |
|---|
| https://www.medicaid.gov/themes/custom/medicaid/images/logo/medicaid_logo_green.svg | Medicaid.gov: Keeping America Healthy 2 alt variants | Looks good | — | 3 KB | 5817 | 5817 |
|---|
| https://www.medicaid.gov/themes/custom/medicaid/dist/img/icon-https.svg | decorative | Decorative | — | 0 KB | 5817 | 5817 |
|---|
| https://www.medicaid.gov/themes/custom/medicaid/dist/img/icon-dot-gov.svg | decorative | Decorative | — | 0 KB | 5817 | 5817 |
|---|
| https://www.medicaid.gov/themes/custom/medicaid/dist/img/us_flag_small.png | decorative | Decorative | — | 0 KB | 5817 | 5817 |
|---|
| https://www.medicaid.gov/tmsis/dataguide/v4/static/img/medicaid_logo_green.svg | Medicaid.gov | Looks good | — | 4 KB | 643 | 643 |
|---|
| https://www.medicaid.gov/tmsis/dataguide/v4/static/img/tmsis_logo.png | TMSIS Dataguide | Looks good | — | 2 KB | 643 | 643 |
|---|
| https://www.medicaid.gov/tmsis/dataguide/v4/static/img/icon-dot-gov.svg | decorative | Decorative | — | 0 KB | 643 | 643 |
|---|
| https://www.medicaid.gov/tmsis/dataguide/v4/static/img/icon-https.svg | decorative | Decorative | — | 0 KB | 643 | 643 |
|---|
| https://www.medicaid.gov/tmsis/dataguide/v4/static/img/us_flag_small.png | decorative | Decorative | — | 0 KB | 643 | 643 |
|---|
| https://www.medicaid.gov/tmsis/dataguide/v3/static/img/medicaid_logo_green.svg | Medicaid.gov | Looks good | — | 4 KB | 403 | 403 |
|---|
| https://www.medicaid.gov/tmsis/dataguide/v3/static/img/tmsis_logo.png | TMSIS Dataguide | Looks good | — | 2 KB | 403 | 403 |
|---|
| https://www.medicaid.gov/tmsis/dataguide/v3/static/img/icon-dot-gov.svg | decorative | Decorative | — | 0 KB | 403 | 403 |
|---|
| https://www.medicaid.gov/tmsis/dataguide/v3/static/img/icon-https.svg | decorative | Decorative | — | 0 KB | 403 | 403 |
|---|
| https://www.medicaid.gov/tmsis/dataguide/v3/static/img/us_flag_small.png | decorative | Decorative | — | 0 KB | 403 | 403 |
|---|
| https://www.medicaid.gov/themes/custom/medicaid/images/loader.gif | Loading... | Looks good | — | 44 KB | 11 | 11 |
|---|
| https://www.medicaid.gov/medicaid/quality-of-care/core-set-data-dashboard/assets/img/us_flag_small.png | decorative | Decorative | — | 0 KB | 4 | 4 |
|---|
| https://www.medicaid.gov/medicaid/quality-of-care/core-set-data-dashboard/assets/img/expand-more.svg | decorative | Decorative | — | 0 KB | 4 | 4 |
|---|
| https://www.medicaid.gov/medicaid/quality-of-care/core-set-data-dashboard/assets/img/core-set-logo-nav.svg | Core Set Logo | Looks good | — | 4 KB | 3 | 3 |
|---|
| https://www.medicaid.gov/sites/default/files/2019-12/icon_white_resources.png | decorative | Decorative | — | 1 KB | 1 | 3 |
|---|
| https://www.medicaid.gov/medicaid/quality-of-care/core-set-data-dashboard/assets/img/x-twitter.svg | CMS Twitter account | Looks good | — | 0 KB | 3 | 3 |
|---|
| https://www.medicaid.gov/medicaid/quality-of-care/core-set-data-dashboard/assets/img/youtube-logo.svg | CMS YouTube account | Looks good | — | 0 KB | 3 | 3 |
|---|
| https://imp.edit.medicaid.gov/medicaid/data-and-systems/images/medium-blue-box.png | legend icon medium blue | Looks good | — | — | 3 | 3 |
|---|
| https://www.medicaid.gov/dq-atlas/assets/medicaid_logo_blue.svg | Medicaid home | Looks good | — | 4 KB | 2 | 2 |
|---|
| https://www.medicaid.gov/dq-atlas/assets/flag.png | decorative | Decorative | — | 1 KB | 2 | 2 |
|---|
| https://www.medicaid.gov/sites/default/files/2025-04/F_CSSTATETIMEANIM_updated_2.gif | F_CSSTATETIMEANIM_updated | Looks good | lazy | 642 KB | 1 | 1 |
|---|
| https://www.medicaid.gov/sites/default/files/2026-09/rural-health-logo-final_rural-health-logo.png | RHTP icon | Looks good | lazy | 33 KB | 1 | 1 |
|---|
| https://www.medicaid.gov/sites/default/files/2025-05/24-firstclock_1_0.png | Dashboard titled “2024 number approved & percentage approved on first clock” displays eight bar charts grouped by SPAs, 1915(c) amendments, 1915(c) new/renewals, and 1915(b) actions. For SPAs, 231 were approved in Q1 with 76% on first clock, and 241 in Q2 with 79%. For 1915(c) amendments, 70 were approved in Q1 with 93% on first clock, and 55 in Q2 with 73%. For 1915(c) new/renewals, Q1 shows 7 approvals with 39% on first clock, and Q2 shows 18 approvals with 86%. For 1915(b) actions, Q1 had 5 approvals with 71% on first clock, and Q2 had 13 with 81%. All values for Q3 and Q4 are zero. | Too long | — | 33 KB | 1 | 1 |
|---|
| https://www.medicaid.gov/media/file/26-q1-firstclock0.png | Dashboard titled ‘2026 number approved & percentage approved on first clock’ displays eight bar charts grouped by SPAs, 1915(c) amendments, 1915(c) new/renewals, and 1915(b) actions. For SPAs, 146 were approved in Q1 with 72% on first clock. For 1915(c) amendments, 47 were approved in Q1 with 87% on first clock. For 1915(c) new/renewals, Q1 shows 3 approvals with 50% on first clock. For 1915(b) actions, Q1 had 6 approvals with 67% on first clock. All values for Q2, Q3, and Q4 are zero. | Too long | — | 31 KB | 1 | 1 |
|---|
| https://www.medicaid.gov/sites/default/files/2021-02/HIE-map-01292021.png | Territories with HIE IAPDs Approved or in the First Time Review Process Alabama: Approved, Alaska: Approved, Arizona: Approved, Arkansas: Approved, California: Approved, Colorado: Approved, Connecticut: Approved, DC: Approved, Delaware: Approved, Florida: Approved, Georgia: Approved, Hawaii: Approved, Idaho: Approved, Illinois: Cancelled Indiana: Approved, Iowa: Approved, Kansas: Approved, Kentucky: Approved, Louisiana: Approved, Maine: Approved, Maryland: Approved, Massachusetts: Approv | Too long | lazy | 30 KB | 1 | 1 |
|---|
| https://www.medicaid.gov/tmsis/dataguide/v3/media/images/mcr_overview.width-800.png | mcr_overview | Looks good | — | 26 KB | 1 | 1 |
|---|
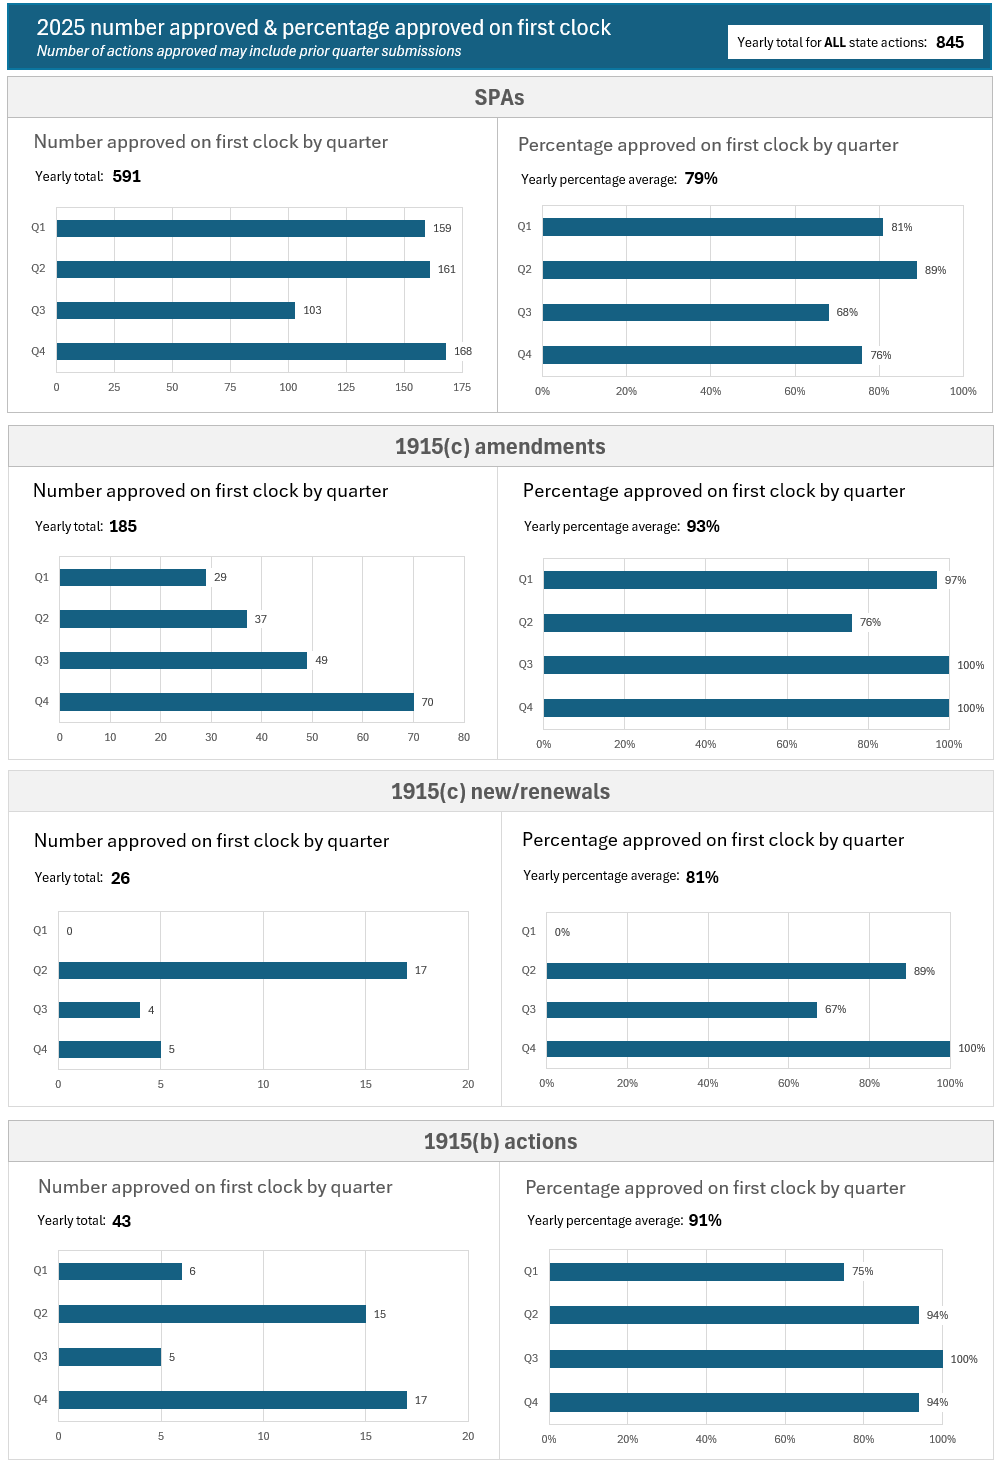
| https://www.medicaid.gov/sites/default/files/2026-03/25-firstclock.png | Dashboard titled “2024 number approved & percentage approved on first clock” displays eight bar charts grouped by SPAs, 1915(c) amendments, 1915(c) new/renewals, and 1915(b) actions. For SPAs, 231 were approved in Q1 with 76% on first clock, and 241 in Q2 with 79%. For 1915(c) amendments, 70 were approved in Q1 with 93% on first clock, and 55 in Q2 with 73%. For 1915(c) new/renewals, Q1 shows 7 approvals with 39% on first clock, and Q2 shows 18 approvals with 86%. For 1915(b) actions, Q1 had 5 approvals with 71% on first clock, and Q2 had 13 with 81%. All values for Q3 and Q4 are zero. | Too long | — | 21 KB | 1 | 1 |
|---|
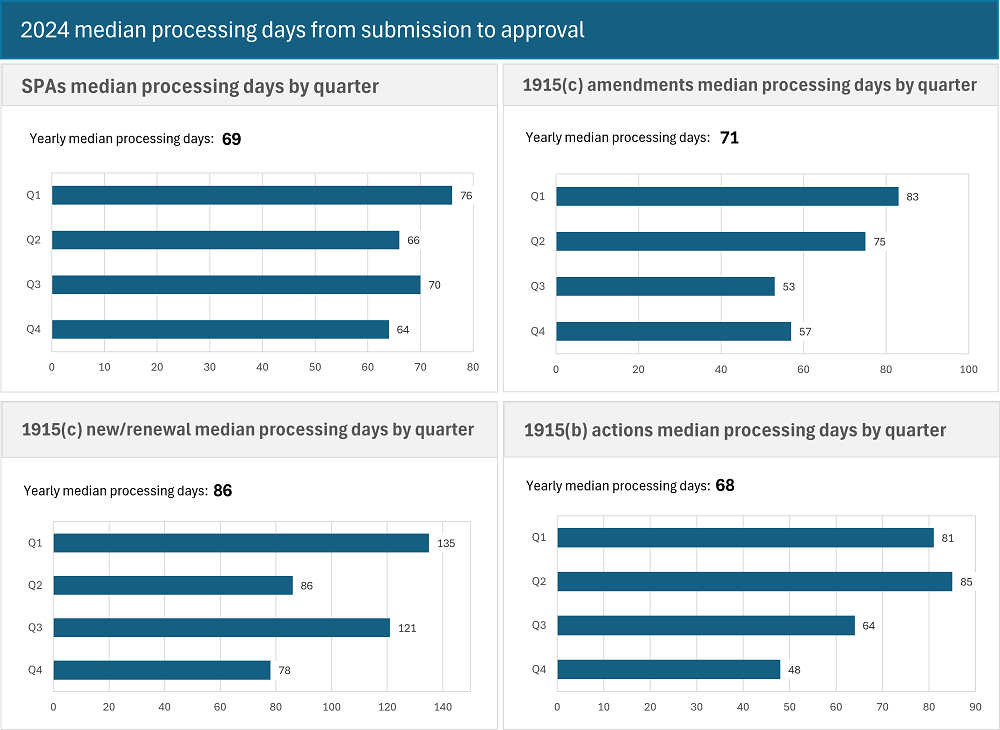
| https://www.medicaid.gov/sites/default/files/2025-05/24-median-days_0_0.png | Dashboard titled “2024 median processing days from submission to approval” displays four bar charts showing quarterly median processing times for different categories. For SPAs, the median processing time was 76 days in Q1 and 66 days in Q2. For 1915(c) amendments, it was 83 days in Q1 and 75 days in Q2. For 1915(c) new or renewal actions, Q1 had 135 median days and Q2 had 86. For 1915(b) actions, the median was 81 days in Q1 and 85 in Q2. All values for Q3 and Q4 are zero across all charts. | Too long | — | 17 KB | 1 | 1 |
|---|
| https://www.medicaid.gov/media/file/26-q1-mediandays0.png | Dashboard titled ‘2026 median processing days from submission to approval’ displays four bar charts showing quarterly median processing times for different categories. For SPAs, the median processing time was 83 days in Q1. For 1915(c) amendments, it was 54 days in Q1. For 1915(c) new or renewal actions, Q1 had 96 median days. For 1915(b) actions, the median was 46 days in Q1. All values for Q2, Q3, and Q4 are zero across all charts. | Too long | — | 16 KB | 1 | 1 |
|---|
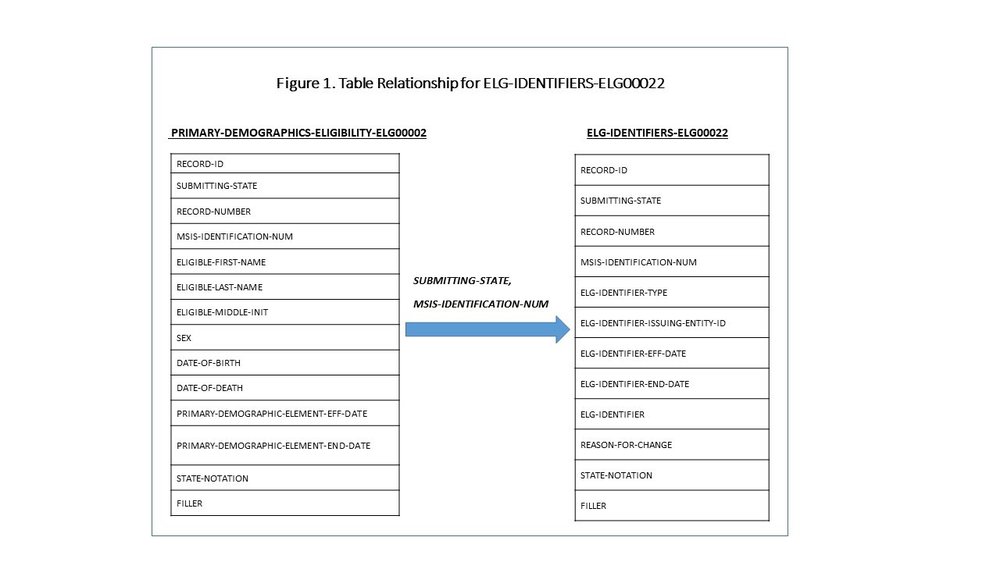
| https://www.medicaid.gov/tmsis/dataguide/v3/media/images/tmsis-table-figure-1_0.width-1000.jpg | tmsis-table-figure-1_0 | Looks good | — | 15 KB | 1 | 1 |
|---|
| https://www.medicaid.gov/media/file/26-q1-approvedactions0.png | Dashboard titled ‘2026 number of approved actions’ with four bar charts. Top left chart: SPAs approved—202 in Q1. Top right chart: 1915(c) amendments approved—54 in Q1. Bottom left chart: 1915(c) new/renewals—6 in Q1. Bottom right chart: 1915(b) actions submitted—9 in Q1. All charts show no bar for Q2, Q3, and Q4. | Too long | — | 13 KB | 1 | 1 |
|---|
| https://www.medicaid.gov/sites/default/files/2026-03/25-median-days.png | Dashboard titled “2024 median processing days from submission to approval” displays four bar charts showing quarterly median processing times for different categories. For SPAs, the median processing time was 76 days in Q1 and 66 days in Q2. For 1915(c) amendments, it was 83 days in Q1 and 75 days in Q2. For 1915(c) new or renewal actions, Q1 had 135 median days and Q2 had 86. For 1915(b) actions, the median was 81 days in Q1 and 85 in Q2. All values for Q3 and Q4 are zero across all charts. | Too long | — | 13 KB | 1 | 1 |
|---|
| https://www.medicaid.gov/sites/default/files/2025-05/24-approvedactions_0.png | Dashboard titled ‘2024 number of approved actions’ with four bar charts. Top left: SPAs approved—302 in Q1, 304 in Q2. Top right: 1915(c) amendments approved—75 in both Q1 and Q2. Bottom left: 1915(c) new/renewals—18 in Q1, 21 in Q2. Bottom right: 1915(b) actions submitted—7 in Q1, 16 in Q2. All charts show zero for Q3 and Q4. | Too long | — | 11 KB | 1 | 1 |
|---|
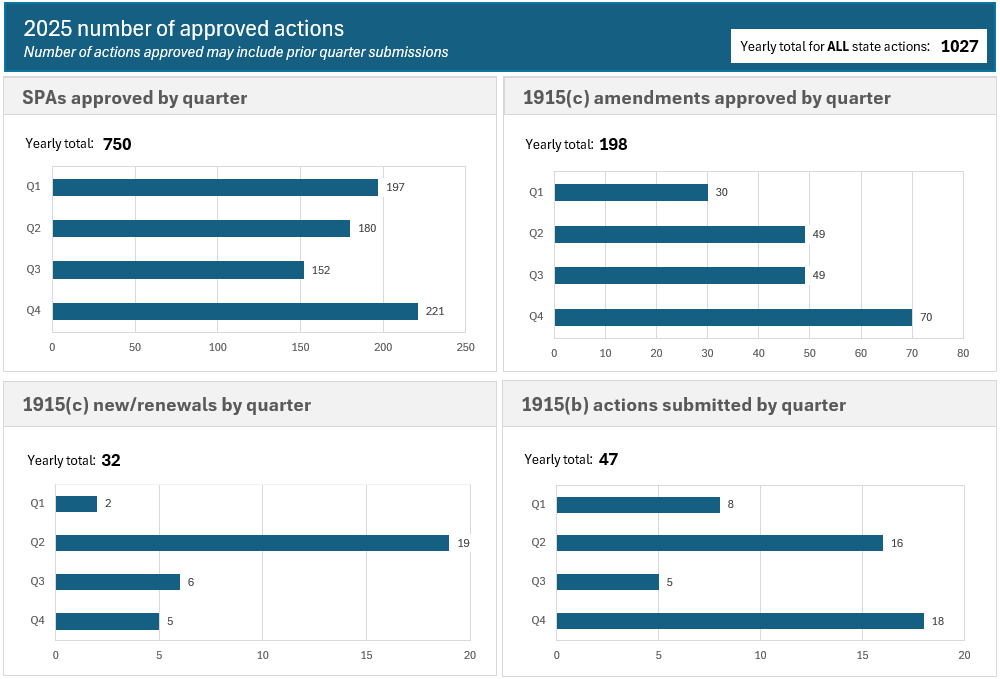
| https://www.medicaid.gov/sites/default/files/2026-03/25-approvedactions.png | Dashboard titled ‘2024 number of approved actions’ with four bar charts. Top left: SPAs approved—302 in Q1, 304 in Q2. Top right: 1915(c) amendments approved—75 in both Q1 and Q2. Bottom left: 1915(c) new/renewals—18 in Q1, 21 in Q2. Bottom right: 1915(b) actions submitted—7 in Q1, 16 in Q2. All charts show zero for Q3 and Q4. | Too long | — | 11 KB | 1 | 1 |
|---|
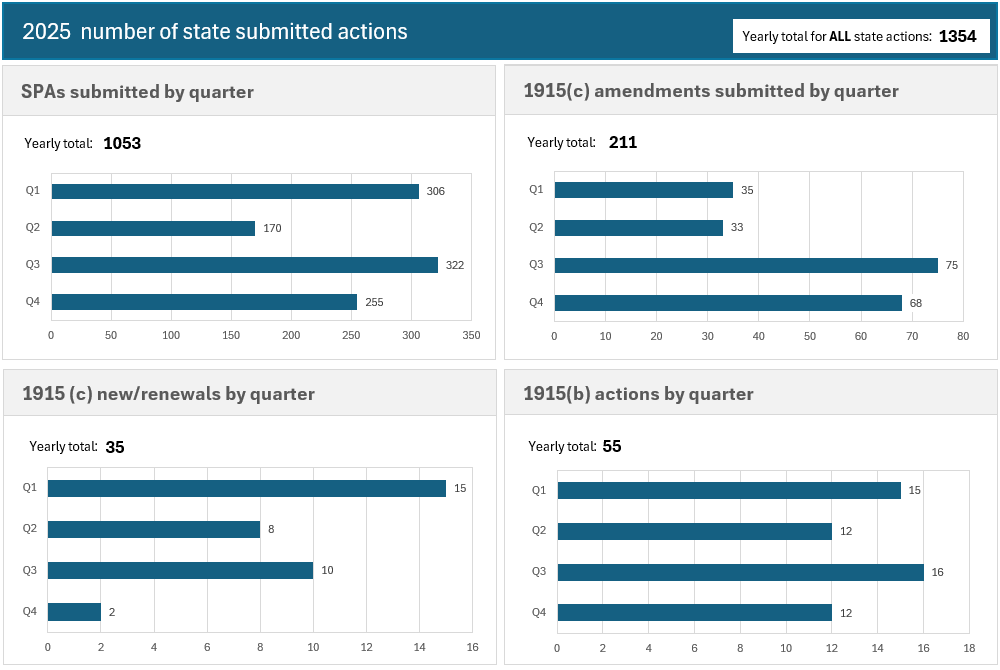
| https://www.medicaid.gov/sites/default/files/2026-03/25-statesubmitted.png | Dashboard titled ‘2024 number of state submitted actions’ showing four bar charts. Top left: SPAs submitted—306 in Q1, 224 in Q2. Top right: 1915(c) amendments—49 in Q1, 47 in Q2. Bottom left: 1915(c) new/renewals—18 in Q1, 8 in Q2. Bottom right: 1915(b) actions—8 in Q1, 11 in Q2. All charts show zero for Q3 and Q4. | Too long | — | 11 KB | 1 | 1 |
|---|
| https://www.medicaid.gov/media/file/26-q1-statesubmitted0.png | Dashboard titled ‘2026 number of state submitted actions’ showing four bar charts. Top left chart: SPAs submitted—189 in Q1. Top right chart: 1915(c) amendments—53 in Q1. Bottom left chart: 1915(c) new/renewals—23 in Q1. Bottom right chart: 1915(b) actions—11 in Q1. All charts show no bar for Q2, Q3, and Q4. | Too long | — | 11 KB | 1 | 1 |
|---|
| https://www.medicaid.gov/sites/default/files/2021-05/infographic_2.png | Data & Systems | Looks good | lazy | 11 KB | 1 | 1 |
|---|
| https://www.medicaid.gov/sites/default/files/2025-05/24-statesubmitted_0.png | Dashboard titled ‘2024 number of state submitted actions’ showing four bar charts. Top left: SPAs submitted—306 in Q1, 224 in Q2. Top right: 1915(c) amendments—49 in Q1, 47 in Q2. Bottom left: 1915(c) new/renewals—18 in Q1, 8 in Q2. Bottom right: 1915(b) actions—8 in Q1, 11 in Q2. All charts show zero for Q3 and Q4. | Too long | — | 9 KB | 1 | 1 |
|---|
| https://www.medicaid.gov/sites/default/files/2023-08/maternal%20health-motherandchild_2_0.png | maternal_health-motherandchild | Looks good | lazy | 3 KB | 1 | 1 |
|---|
| https://www.medicaid.gov/sites/default/files/2024-09/ico-alert_1.png | alert icon | Looks good | — | 1 KB | 1 | 1 |
|---|
| https://www.medicaid.gov/sites/default/files/2024-09/ico_call_0.png | call icon | Looks good | — | 0 KB | 1 | 1 |
|---|
| https://www.medicaid.gov/sites/default/files/2024-09/ico_chat_0.png | chat icon | Looks good | — | 0 KB | 1 | 1 |
|---|
| https://jira.cms.gov/images/icons/mail_small.gif | decorative | Decorative | — | 0 KB | 1 | 1 |
|---|
| https://www.medicaid.gov/sites/default/files/2024-09/ico_text_0.png | text icon | Looks good | — | 0 KB | 1 | 1 |
|---|
| https://medicaid.gov/sites/default/files/2024-12/23-statesubmitted.png | Dashboard titled “2023 number of state submitted actions” displays data visualizations for SPAs, 1915(c) amendments, 1915(c) new or renewals, and 1915(b) actions, broken down by quarter. The total number of all state-submitted actions is 1,924. For SPAs, the total is 1,414, with 1,297 standard and 117 disaster relief submissions. SPA submissions by quarter show Q1 with 327 standard and 44 disaster relief, Q2 with 267 and 72, Q3 with 411 and 1, and Q4 with 292 standard submissions only. For 1915(c) amendments, the yearly total is 408, split into 267 standard and 141 Appendix K. For 1915(c) amendments, the yearly total is 408, split into 267 standard and 141 Appendix K. Submissions by quarter show Q1 with 34 standard and 35 Appendix K, Q2 with 60 and 73, Q3 with 83 and 22, and Q4 with 80 standard and 11 Appendix K. The 1915(c) new or renewals totaled 61 for the year, with 29 in Q1, 11 in Q2, 12 in Q3, and 9 in Q4. The 1915(b) actions reached a yearly total of 41, with 9 in Q1, 8 in Q2, 14 in Q3, and 10 in Q4. | Too long | — | — | 1 | 1 |
|---|
| https://medicaid.gov/sites/default/files/2024-12/23-approvedactions.png | Dashboard titled “2023 number of approved actions” shows four bar charts summarizing approvals by quarter across different categories, with a total of 1,815 approved state actions. For SPAs, the total is 1,324, with 1,165 standard and 159 disaster relief approvals. Approvals by quarter include Q1 with 218 standard and 49 disaster relief, Q2 with 343 and 88, Q3 with 235 and 17, and Q4 with 369 standard and 5 disaster relief. For 1915(c) amendments, the yearly total is 376, divided into 226 standard and 150 Appendix K approvals. Approvals by quarter show Q1 with 40 standard and 57 Appendix K, Q2 with 59 and 49, Q3 with 50 and 38, and Q4 with 77 standard and 6 Appendix K. The 1915(c) new/renewals category totals 73 approvals, with 11 in Q1, 36 in Q2, 19 in Q3, and 7 in Q4. For 1915(b) actions, the yearly total is 42, with 10 in Q1, 10 in Q2, 7 in Q3, and 15 in Q4. | Too long | — | — | 1 | 1 |
|---|
| https://medicaid.gov/sites/default/files/2024-12/23-firstclock_0.png | Dashboard titled “2023 number of approved actions and percentage approved on first clock” includes a total of 1,525 state actions. For SPAs, the yearly total is 1,093. In Q1, there were 165 standard and 41 disaster relief approvals; in Q2, 285 standard and 74 disaster relief; in Q3, 200 standard and 11 disaster relief; and in Q4, 306 standard and 11 disaster relief approvals. The yearly percentage average for SPAs is 83%, with Q1 showing 82% standard and 85% disaster relief, Q2 showing 86% and 84%, Q3 showing 87% and 73%, and Q4 showing 89% for standard and 40% for disaster relief. For 1915(c) amendments, the yearly total is 351. Q1 had 40 standard and 54 Appendix K approvals, Q2 had 59 and 49, Q3 had 50 and 38, and Q4 had 58 standard and 3 Appendix K. The yearly percentage average for 1915(c) amendments is 93%, with Q1 showing 95% standard and 93% Appendix K, Q2 showing 97% and 94%, Q3 showing 94% and 92%, and Q4 showing 98% standard and 100% Appendix K. For 1915(c) new or renewals, the total is 44, with 5 in Q1, 26 in Q2, 10 in Q3, and 3 in Q4. The yearly percentage average is 60%, with Q1 at 40%, Q2 at 82%, Q3 at 21%, and Q4 at 43%. For 1915(b) actions, the yearly total is 37, with 9 in Q1, 8 in Q2, 6 in Q3, and 14 in Q4. The yearly percentage average is 88%, with Q1 at 89%, Q2 at 88%, Q3 at 87%, and Q4 at 87%. | Too long | — | — | 1 | 1 |
|---|
| https://medicaid.gov/sites/default/files/2024-12/23-mediandays.png | Dashboard titled “2023 median processing days from submission to approval” are shown across four categories. For SPAs, the yearly median is 75 days. In Q1, median processing times were 80 days for standard and 63 for disaster relief; Q2 had 81 and 41; Q3 had 75 and 38; and Q4 had 70 days for standard and 218 for disaster relief. For 1915(c) amendments, the yearly median is 59 days. In Q1, standard took 84 days and Appendix K 36; Q2 had 75 and 21; Q3 had 60 and 48; and Q4 had 74 for standard and 33 for Appendix K. For 1915(c) new or renewals, the yearly median is 89 days, with Q1 at 179, Q2 at 87, Q3 at 218, and Q4 at 154. For 1915(b) actions, the yearly median is 73 days, with Q1 at 78, Q2 at 76, Q3 at 65, and Q4 at 67. | Too long | — | — | 1 | 1 |
|---|
| https://medicaid.gov/sites/default/files/2024-12/22-statesubmitted.png | Dashboard Title: 2022 Number of State Submitted Actions. The total number of state submitted actions in 2022 was 1,861. For SPAs, the yearly total was 1,295, with 1,161 standard and 134 disaster relief submissions. Q1 included 295 standard and 41 disaster relief, Q2 had 268 and 32, Q3 recorded 349 and 25, and Q4 had 249 standard and 36 disaster relief. For 1915(c) amendments, the total was 475, composed of 169 standard and 306 Appendix K submissions. Q1 showed 40 standard and 109 Appendix K, Q2 had 50 and 79, Q3 had 32 and 76, and Q4 had 47 standard and 42 Appendix K. The 1915(c) new or renewals category had a yearly total of 59, with 19 in Q1, 15 in Q2, 13 in Q3, and 12 in Q4. For 1915(b) actions, the yearly total was 32, with 14 in Q1, 2 in Q2, 5 in Q3, and 11 in Q4. | Too long | — | — | 1 | 1 |
|---|
| https://medicaid.gov/sites/default/files/2024-12/22-approvedactions.png | Dashboard Title: 2022 Number of Approved Actions. The total number of approved state actions in 2022 was 1,764. For SPAs, the yearly total was 1,199, with approvals including 228 standard and 47 disaster relief in Q1, 287 and 35 in Q2, 248 and 24 in Q3, and 305 standard and 25 disaster relief in Q4. For 1915(c) amendments, the total was 483, consisting of 14 standard and 145 Appendix K in Q1, 49 and 58 in Q2, 40 and 96 in Q3, and 41 standard and 42 Appendix K in Q4. The 1915(c) new or renewals category had a total of 50 approvals, with 11 in Q1, 17 in Q2, 11 in Q3, and 11 in Q4. For 1915(b) actions, the yearly total was 32, including 9 in Q1, 10 in Q2, 5 in Q3, and 8 in Q4. | Too long | — | — | 1 | 1 |
|---|
| https://medicaid.gov/sites/default/files/2024-12/22-firstclock_0.png | Dashboard Title: 2022 Number Approved & Percentage Approved on First Clock. The total number of approved state actions in 2022 was 1,465. For SPAs, the yearly total was 980, with Q1 including 190 standard and 5 disaster relief, Q2 with 237 and 8, Q3 with 194 and 10, and Q4 with 326 standard and 10 disaster relief. The yearly percentage average for SPAs was 82%, with standard approvals ranging from 77% to 89% and disaster relief ranging from 60% to 78% across quarters. For 1915(c) amendments, the yearly total was 442, with Q1 including 34 standard and 144 Appendix K, Q2 with 38 and 52, Q3 with 27 and 88, and Q4 with 47 standard and 12 Appendix K. The yearly percentage average was 92%, with standard consistently at or near 100%, and Appendix K ranging from 60% to 95%. For 1915(c) new or renewals, the total was 25, with 4 in Q1, 13 in Q2, 5 in Q3, and 3 in Q4. The percentage approved on first clock for this group averaged 50%, with Q1 at 33%, Q2 at 77%, Q3 at 40%, and Q4 at 33%. For 1915(b) actions, the total was 18, including 3 in Q1, 6 in Q2, 4 in Q3, and 5 in Q4. The yearly percentage average was 56%, with quarterly values ranging from 40% to 75%. | Too long | — | — | 1 | 1 |
|---|
| https://medicaid.gov/sites/default/files/2024-12/22-mediandays.png | Dashboard Title: 2022 Median Processing Days from Submission to Approval. The yearly median processing time for SPAs was 76 days. In Q1, standard SPAs took 71 days and disaster relief took 63; in Q2, standard took 73 and disaster relief 78; in Q3, standard took 81 and disaster relief 75; and in Q4, standard took 75 days while disaster relief took 67. For 1915(c) amendments, the overall median was 54 days. Q1 had 75 days for standard and 40 for Appendix K; Q2 had 86 and 44; Q3 had 82 and 42; and Q4 had 82 for standard and 43 for Appendix K. The median processing time for 1915(c) new or renewals was 126 days, with Q1 at 160, Q2 at 89, Q3 at 161, and Q4 at 104. For 1915(b) actions, the median was 89 days, with Q1 at 72, Q2 at 90, Q3 at 132, and Q4 at 286. | Too long | — | — | 1 | 1 |
|---|